Score,Cross-vlidated scores
사이킷런에서 제공하는 모든 estimator는 score 함수를 가지고 있다.score 메소드는 새로운 데이터를 얼마나 잘 예측하는지 판단할 수 있는 지표이다.
값이 클수록 좋은 모델이다.
from sklearn import datasets, svm

X_digits, y_digits = datasets.load_digits(return_X_y=True)
svc = svm.SVC(C=1, kernel='linear')
svc.fit(X_digits[:-100], y_digits[:-100]).score(X_digits[-100:], y_digits[-100:])0.98예측 정확도를 더 잘 측정하기 위해 학습데이터와 테스트 데이터를 k개로 나누어 적용한다.
이것을 k-fold cross-validation 이라고 한다.
import numpy as np

X_folds = np.array_split(X_digits, 3)
y_folds = np.array_split(y_digits, 3)
scores = []

#전체 데이터셋을 3개로 나눔(599개씩 3분할)
for k in range(3):
    X_train = list(X_folds)
    X_test = X_train.pop(k)
    X_train = np.concatenate(X_train)
    y_train = list(y_folds)
    y_test = y_train.pop(k)
    y_train = np.concatenate(y_train)
    scores.append(svc.fit(X_train, y_train).score(X_test, y_test))
print(scores)
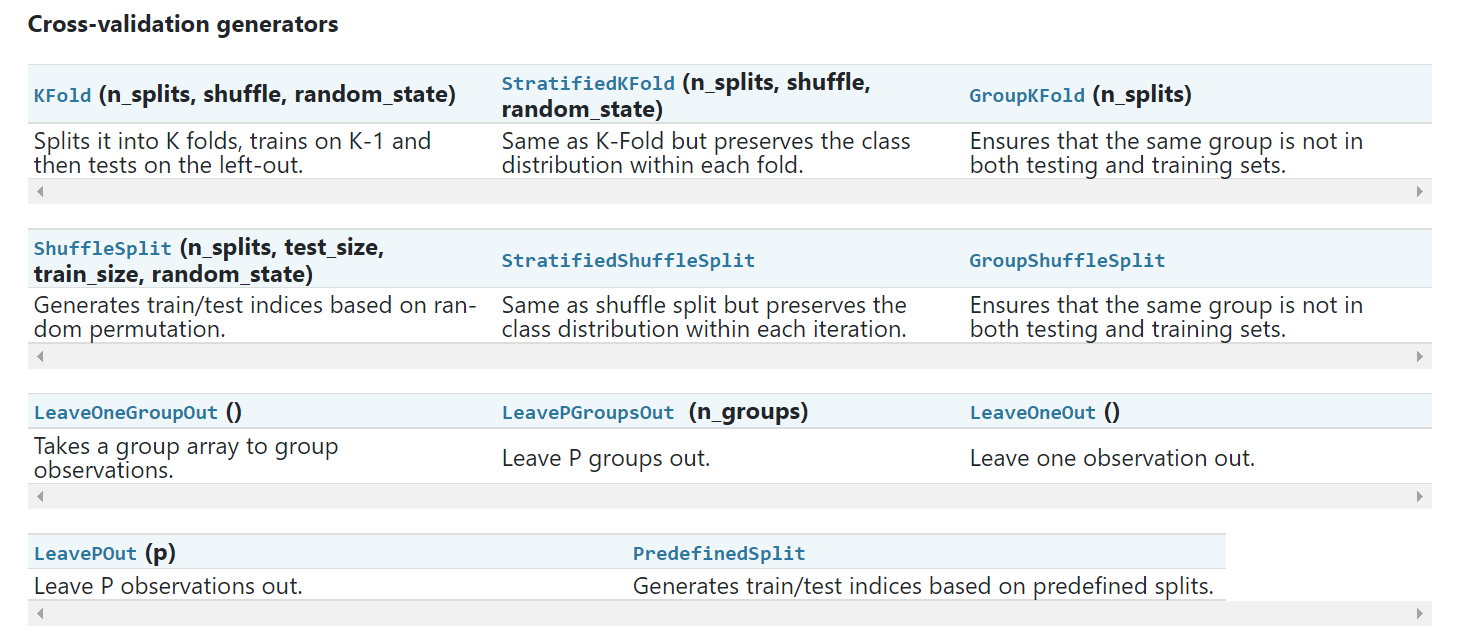
[0.9348914858096828, 0.9565943238731218, 0.9398998330550918]Cross-validation generators
매번 위처럼 반복문으로 데이터를 수동으로 나눠주는 것은 불편하기 때문에 사이킷런에서는 train/test의 인덱스 리스트로 cross-validation datasets을 구성할 수 있는 방법을 제공한다.
from sklearn.model_selection import KFold, cross_val_score

X = ["a", "a", "a", "b", "b", "c", "c", "c", "c", "c"]
k_fold = KFold(n_splits=5)
for train_indices, test_indices in k_fold.split(X):
     print('Train: %s | test: %s' % (train_indices, test_indices))
Train: [2 3 4 5 6 7 8 9] | test: [0 1]
Train: [0 1 4 5 6 7 8 9] | test: [2 3]
Train: [0 1 2 3 6 7 8 9] | test: [4 5]
Train: [0 1 2 3 4 5 8 9] | test: [6 7]
Train: [0 1 2 3 4 5 6 7] | test: [8 9]사용하고있던 digits 데이터셋을 적용해보자.
[svc.fit(X_digits[train], y_digits[train]).score(X_digits[test], y_digits[test]) for train, test in k_fold.split(X_digits)][0.9638888888888889,
0.9222222222222223,
0.9637883008356546,
0.9637883008356546,
0.9303621169916435]list comphrehension으로 표시해서 복잡해 보일 수 있지만 차근차근 보자.
k_fold.split(X_digits)로 X_digits의 인덱스를 사용하여 train, test를 나눈다.
각 인덱스를 X_digits과 y_digits에 인덱싱하여 svc 모델의 학습fit과 정확도 측정score을 진행한다.
사이킷런에서는 cross-validation score를 계산하는 것도 매우 간편하게 구할 수 있도록 cross_val_score를 제공한다.
cross_val_score(svc, X_digits, y_digits, cv=k_fold, n_jobs=-1) array([0.96388889, 0.92222222, 0.9637883 , 0.9637883 , 0.93036212])파라미터 정보
sklearn.model_selection.cross_val_score(estimator, X, y=None, cv=None, n_jobs=None,...)
- estimator : 데이터 학습시킬 모델 객체
- X : 데이터
- y : 타겟 데이터
- cv : cross-validation generator, None이면 5-fold corss validation, 특정 숫자이면 숫자KFold 등
- n_jobs : 병렬 처리할 job 수, None이면 1, -1 설정 시 모든 프로세서를 사용함.
scoring 파라미터를 설정해주면 특정 scoring method를 적용할 수 있다.
cross_val_score(svc, X_digits, y_digits, cv=k_fold, scoring='precision_macro')array([0.96578289, 0.92708922, 0.96681476, 0.96362897, 0.93192644])Cross-validation generotrs 종류는 다음과 같다.

연습문제
corss-validation 사용해보기

import numpy as np
from sklearn.model_selection import cross_val_score
from sklearn import datasets, svm

X, y = datasets.load_digits(return_X_y=True)

svc = svm.SVC(kernel='linear')
C_s = np.logspace(-10, 0, 10)

scores = list()
정답
import numpy as np
from sklearn.model_selection import cross_val_score
from sklearn import datasets, svm

X, y = datasets.load_digits(return_X_y=True)

svc = svm.SVC(kernel='linear')
C_s = np.logspace(-10, 0, 10)

scores = list()
scores_std = list()

for C in C_s:
    svc.C = C
    thisscores = cross_val_score(svc, X, y)
    scores.append(np.mean(thisscores))
    scores_std.append(np.std(thisscores))

import matplotlib.pyplot as plt

plt.figure()
plt.semilogx(C_s, scores)
plt.semilogx(C_s, np.array(scores) + np.array(scores_std), 'b--')
plt.semilogx(C_s, np.array(scores) - np.array(scores_std), 'b--')
locs, labels = plt.yticks()
plt.yticks(locs, list(map(lambda x: "%g" % x, locs)))
plt.ylabel('CV score')
plt.xlabel('Parameter C')
plt.ylim(0, 1.1)
plt.show()
Grid Search
사이킷 런에서 cross-validation score를 최대로 만드는 파라미터를 찾기 위해 사용하는 방법이다.
GridSearchCV는 5-fold cross-validation을 사용한다.
from sklearn.model_selection import GridSearchCV, cross_val_score

Cs = np.logspace(-6, -1, 10)
clf = GridSearchCV(estimator=svc, param_grid=dict(C=Cs), n_jobs=-1)
clf.fit(X_digits[:1000], y_digits[:1000])
print(clf.best_score_)

print(clf.best_estimator_.C)

print(clf.score(X_digits[1000:], y_digits[1000:]))
0.95
0.0021544346900318843
0.946047678795483cross-validated estimators
자동적으로 cross-validation으로 파라미터 설정이 되는 estimator가 이다.
from sklearn import linear_model, datasets

lasso = linear_model.LassoCV()
X_diabetes, y_diabetes = datasets.load_diabetes(return_X_y = True)
lasso.fit(X_diabetes, y_diabetes)

lasso.alpha_0.003753767152692203연습문제
diabetes datasets에서 최적의 regularization 파라미터 알파 값을 찾아라.
from sklearn import datasets
from sklearn.linear_model import LassoCV
from sklearn.linear_model import Lasso
from sklearn.model_selection import KFold
from sklearn.model_selection import GridSearchCV

X, y = datasets.load_diabetes(return_X_y=True)
X = X[:150]
정답
import numpy as np
import matplotlib.pyplot as plt

from sklearn import datasets
from sklearn.linear_model import LassoCV
from sklearn.linear_model import Lasso
from sklearn.model_selection import KFold
from sklearn.model_selection import GridSearchCV

X, y = datasets.load_diabetes(return_X_y=True)
X = X[:150]
y = y[:150]

lasso = Lasso()
alphas = np.logspace(-4, -0.5, 30)

tuned_parameters = [{'alpha': alphas}]
n_folds = 5

clf = GridSearchCV(lasso, tuned_parameters, cv=n_folds, refit=False)
clf.fit(X, y)
scores = clf.cv_results_['mean_test_score']
scores_std = clf.cv_results_['std_test_score']
plt.figure().set_size_inches(8,6)
plt.semilogx(alphas, scores)

std_error = scores_std / np.sqrt(n_folds)

plt.semilogx(alphas, scores + std_error, 'b--')
plt.semilogx(alphas, scores - std_error, 'b--')

plt.fill_between(alphas, scores + std_error, scores - std_error, alpha=0.2)

plt.ylabel('CV score +/- std error')
plt.xlabel('alpha')
plt.axhline(np.max(scores), linestyle='--', color='.5')
plt.xlim([alphas[0], alphas[-1]])

plt.show()

# alpha를 어떻게 최적이라고 신뢰할 수 있는가?

lasso_cv = LassoCV(alphas=alphas, random_state=0, max_iter=10000)
k_fold = KFold(3)

print("Answer to the bonus question:",
      "how much can you trust the selection of alpha?")
print()
print("Alpha parameters maximising the generalization score on different")
print("subsets of the data:")
for k, (train, test) in enumerate(k_fold.split(X, y)):
    lasso_cv.fit(X[train], y[train])
    print("[fold {0}] alpha: {1:.5f}, score: {2:.5f}".
          format(k, lasso_cv.alpha_, lasso_cv.score(X[test], y[test])))
print()
print("Answer: Not very much since we obtained different alphas for different")
print("subsets of the data and moreover, the scores for these alphas differ")
print("quite substantially.")
Answer to the bonus question: how much can you trust the selection of alpha?
Alpha parameters maximising the generalization score on different
subsets of the data:
[fold 0] alpha: 0.05968, score: 0.54209
[fold 1] alpha: 0.04520, score: 0.15523
[fold 2] alpha: 0.07880, score: 0.45193
Answer: Not very much since we obtained different alphas for different
subsets of the data and moreover, the scores for these alphas differ
quite substantially.'Machine Learning > scikit-learn diary' 카테고리의 다른 글
| 4. 사이킷런으로 지도 학습해보기 1 (0) | 2021.10.05 |
|---|---|
| 3. 사이킷런의 Estimator object와 그 설정 (0) | 2021.09.28 |
| 2. 사이킷런을 사용하는 머신러닝 (0) | 2021.09.28 |
| 1. 사이킷런 설치 (0) | 2021.09.27 |